Method

How the book calculates

Every decision in the book rests on the same calculation: the KORE mission model. It defines what is on board, what it costs and what can go wrong. This page explains how it is built.

Three levels in the model

  • Level of knowledge: FactReal physics and mathematics, backed by sources in the book.
  • Level of knowledge: ModelResult of the KORE mission model, following published rules.
  • Level of knowledge: FictionSet assumptions: mission, life forms, disruption rates and plot.

What the model contains

Time and distanceLevel of knowledge: FactLevel of knowledge: Fiction
The model counts in cycles of 30 days. Proxima Centauri is 4.24 light years away, the journey takes 300 years.
LightLevel of knowledge: Fact
Three years in Earth orbit with 1,361 W/m² of sunlight, then the light falls with the square of the distance. From year 4 it is practically dark. At Proxima b about 65 percent of Earth's irradiance arrives, mostly red to infrared.
EnergyLevel of knowledge: FactLevel of knowledge: Fiction
The onboard source runs on plutonium-238, half-life 87.7 years, and starts at 2,000 watts. A base load of 60 watts always runs.
Seeds and storageLevel of knowledge: Fiction
41 kilograms in twelve compartments of at most 4 kilograms. Six compartments each hang on one of two cooling loops, growing happens in two chambers.
Six archetypesLevel of knowledge: Fiction
Invented life forms with fixed values: how long the seeds stay viable, how fast they grow, how much light and energy they need, what share is usable and how often a culture fails. A matrix defines how they strengthen or slow each other.
Water and nutrientsLevel of knowledge: Fiction
120 litres of water and 8 kilograms of nutrients. Without recyclers, both are lost cycle by cycle.
Thinking costs energyLevel of knowledge: Fiction
Four thinking modes from 1 watt at rest to 400 watts for deep planning. Below 470 watts of total power there is not enough left for it: the thinking limit.
DisruptionsLevel of knowledge: FactLevel of knowledge: Fiction
Bit errors, sensor failures, micrometeorites and the loss of a cooling loop occur with fixed probabilities. At Proxima, flares are added, which really occur there.
SuccessLevel of knowledge: Fiction
The mission counts as a success if at least three archetypes arrive viable, including the red-light harvester, at least 2 kilograms of usable biomass are harvested within five years of arrival, the risk of total loss is at most 5 percent and nothing is released into the planet's environment.
How it is calculated

Level of knowledge: Model

A single run shows only one possible journey. So the model plays through many journeys with random disruptions and counts how often the mission succeeds. The numbers in the book are calculated by these rules.

The randomness follows fixed seeds. Anyone using the same rules and seeds gets the same result.

Three tools from the book

The sketches show how the model evaluates decisions.

Decision tree

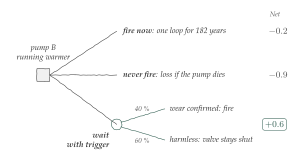
Each option gets probabilities and consequences. Often neither acting nor waiting wins, but a decision tied to a trigger.

Decision tree for the warming pump B: waiting with a trigger has the best net value, plus 0.6.
Chapter 8: decision tree for the emergency valve.Level of knowledge: Model
Image description

Decision tree. Starting point: pump B is running warmer. Three branches, each with a net value. Fire now: one loop for 182 years, net minus 0.2. Never fire: loss if the pump dies, net minus 0.9. Wait with a trigger: with 40 percent the wear is confirmed and the valve is fired. With 60 percent it is harmless and the valve stays shut. This branch has the best net value, plus 0.6, framed in green.

Robust plan

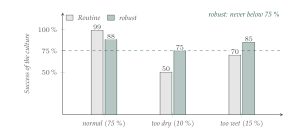
A plan is tested in several possible worlds. The one chosen never falls below a threshold in any of them, even if it delivers a little less in the normal case.

Bar chart: the robust plan stays at 75 percent success or more in all three worlds, the routine plan falls below in two.
Chapter 10: routine versus a robust plan in three worlds.Level of knowledge: Model
Image description

Bar chart: success of the culture in percent for two plans, routine (grey) and robust (green), in three possible worlds. Normal, probability 75 percent: routine 99, robust 88. Too dry, 10 percent: routine 50, robust 75. Too wet, 15 percent: routine 70, robust 85. A dashed line at 75 percent shows that the robust plan never falls below it.

Bottleneck first

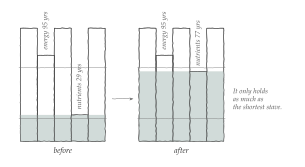
A system only reaches as far as its scarcest resource, Liebig's law of the minimum. More of what is plentiful does not help.

Two barrels: the content only reaches the shortest stave, and a longer nutrients stave raises the fill level.
Chapter 14: the barrel with staves of different lengths.Level of knowledge: Model
Image description

Two barrels made of five staves, before and after. The fill level only reaches the shortest stave. Before, the nutrients stave is the shortest at 29 years, so the barrel is filled only low. The energy stave lasts 95 years. After, the nutrients stave is extended to 77 years and the fill level rises to that point. Note: it only holds as much as the shortest stave.

Recalculate it yourself

The model will be published as the open KORE simulator: a reference in Python and a version that runs in the browser.

To the KORE simulator